Boys & Girls Club of Metro Atlanta Power
Building a robust, intuitive and cost-effective data visualization workspace in Microsoft Power BI.
About Project
The Boys and Girls Club of Metro Atlanta currently uses FormStack and Tableau to create many essential data visualizations. Tableau is costly and inflexible, and the nonprofit needed another data visualization system that is cheaper, compatible with Office 365 products, and customizable to the needs of different stakeholders (Facilities, IT, clubs, etc.). To solve the problem described above, we have created a dynamic data visualization workspace in Microsoft Power BI. We have improved the existing process by dramatically reducing costs, streamlining the number of logins needed, and making a system compatible to automated data input in the future. These three features directly solve major pain points for BGCMA by saving time, money, and reducing technical debt in the future.
Our Client
Boys and Girls Club
Boys & Girls Clubs of Metro Atlanta (BGCMA) works to save and change the lives of children and teens, especially those who need us most, by providing a safe, positive, and engaging environment and programs that prepare and inspire them to achieve great futures. With different clubs spread across Atlanta, each location provides space for learning and enjoyment. The nonprofit's goal by 2020 is to make sure 90% of children coming to their clubs 3 or more days a week are on track to graduate on time, live healthy, and give back to their community.

Our Process
Product Scope
Client Goals 🥅
The project was delineated with 3 general goals to be met. First he solution must be less expensive than the current system, which incorporates Tableau and FormStack. The solution must also be easy to use and compatible with different forms of data input. Finally, the solution must have different views to meet the needs of different users.
End-User Goals ⚽
We also had to make sure to keep three main groups of end users in mind when creating the product. IT directors are the users who will be creating and editing data visualizations. Their needs include an easy-to-use interface, compatibility with Office 365, and administrative access. Other executive directors will have control over how visualizations are created, as well as over the data itself. Their needs include intuitive data upload and update methods and administrative access. Thirdly, club directors use already-created visualizations to gain insights about various aspects of their clubs. Their needs include organized and comprehensive data visualizations and view-only access.
Technology 💻
We built all of our reports and dashboards through the software Microsoft PowerBI. Our developers were able to create the data visualizations through Excel spreadsheets that were uploaded to SharePoint server. This allows for live data visualization.
Our Solution
Key Features
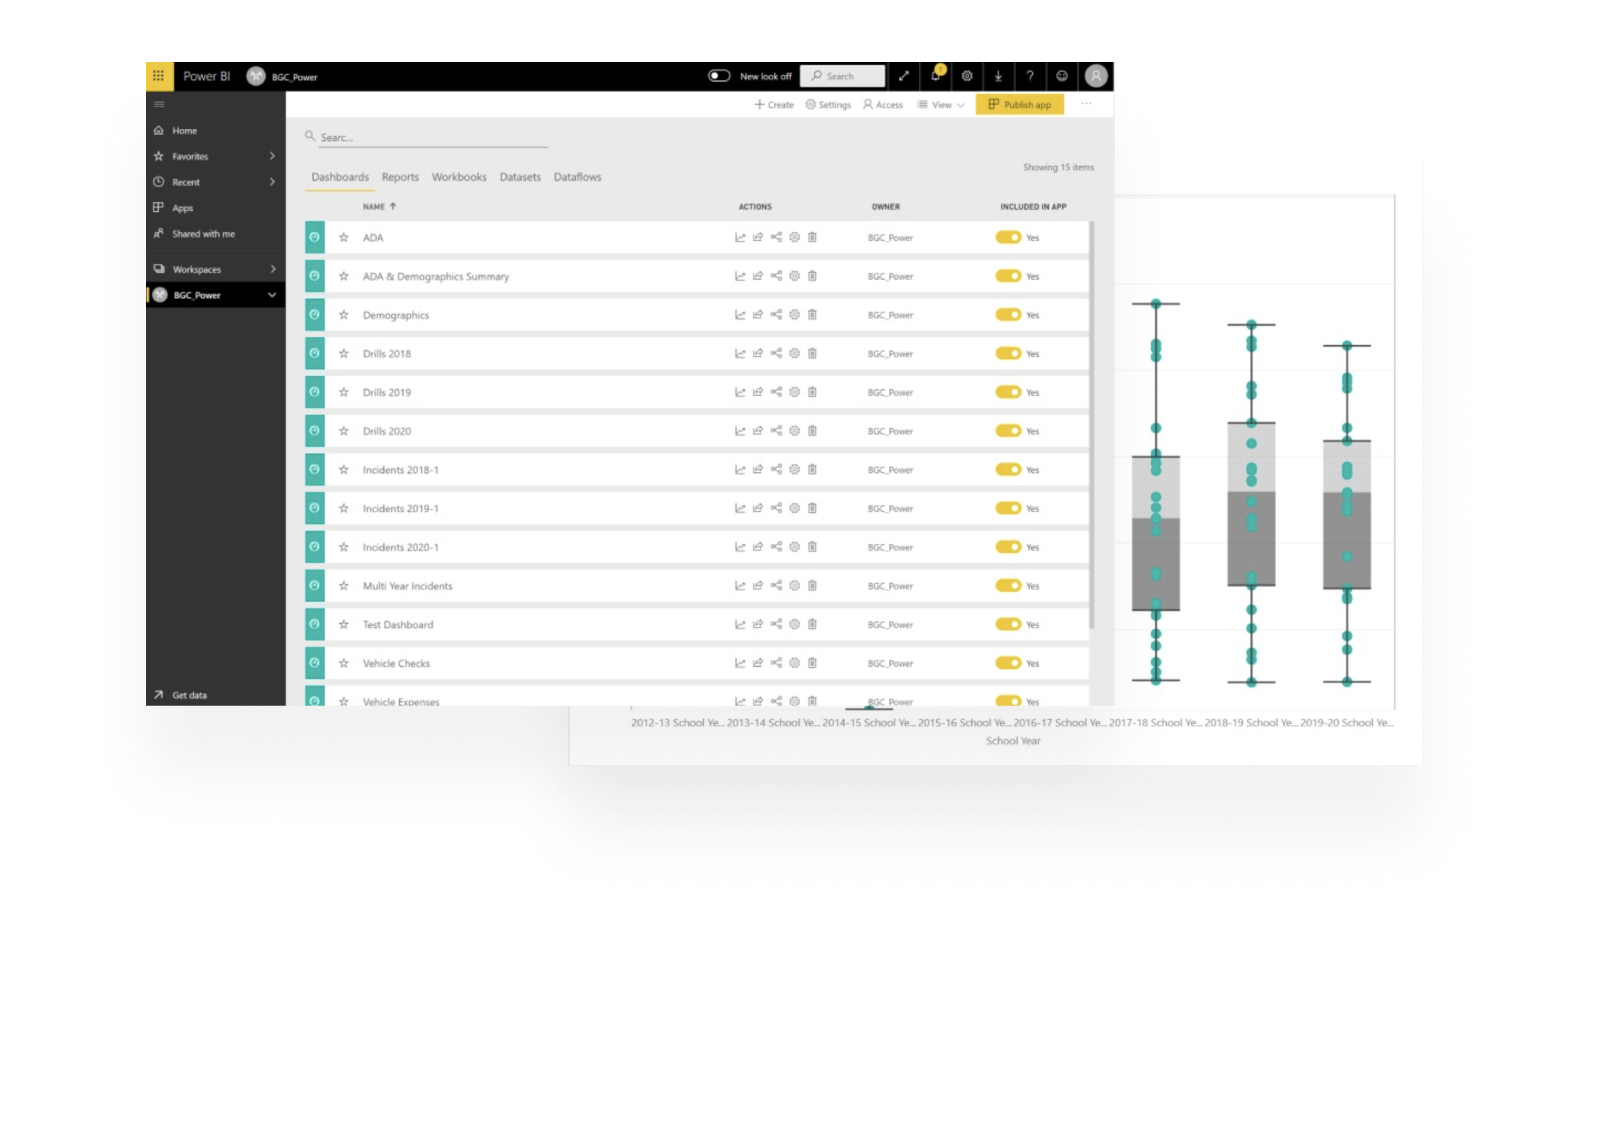
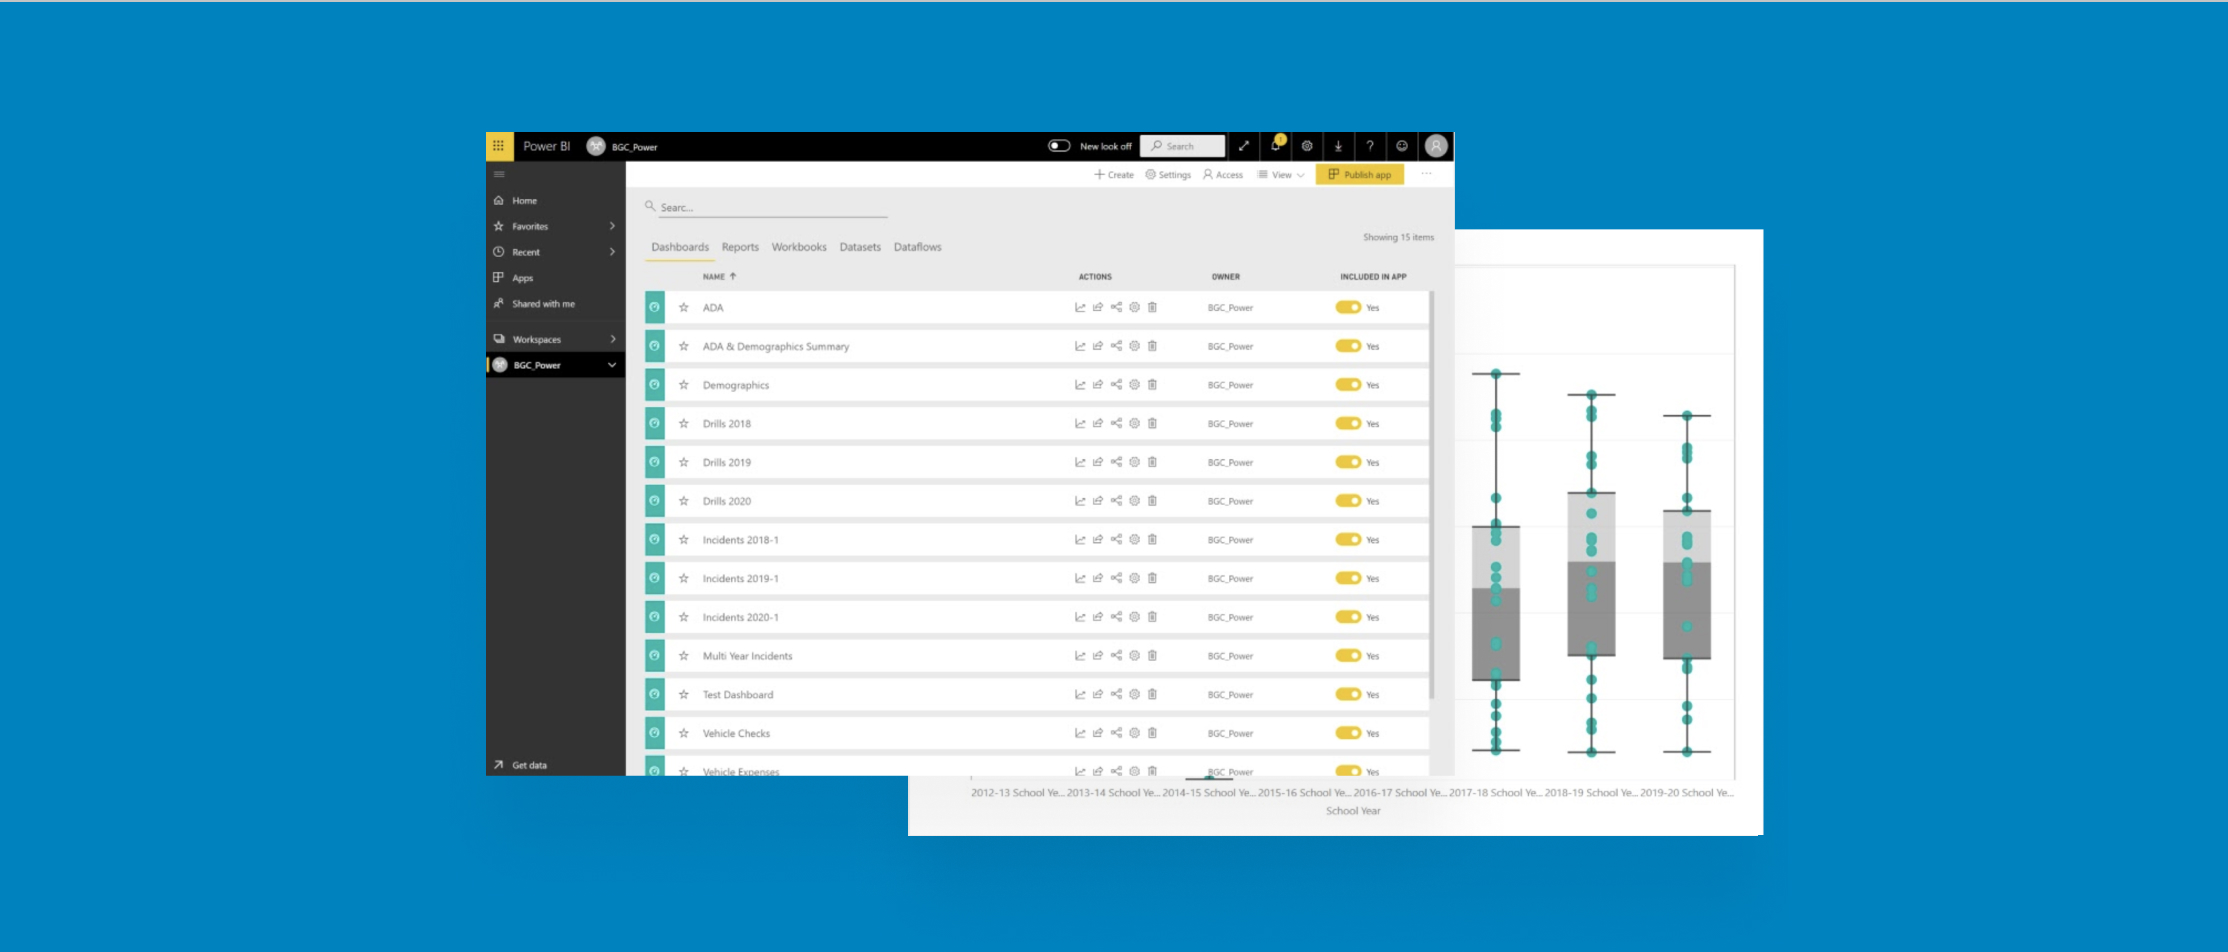
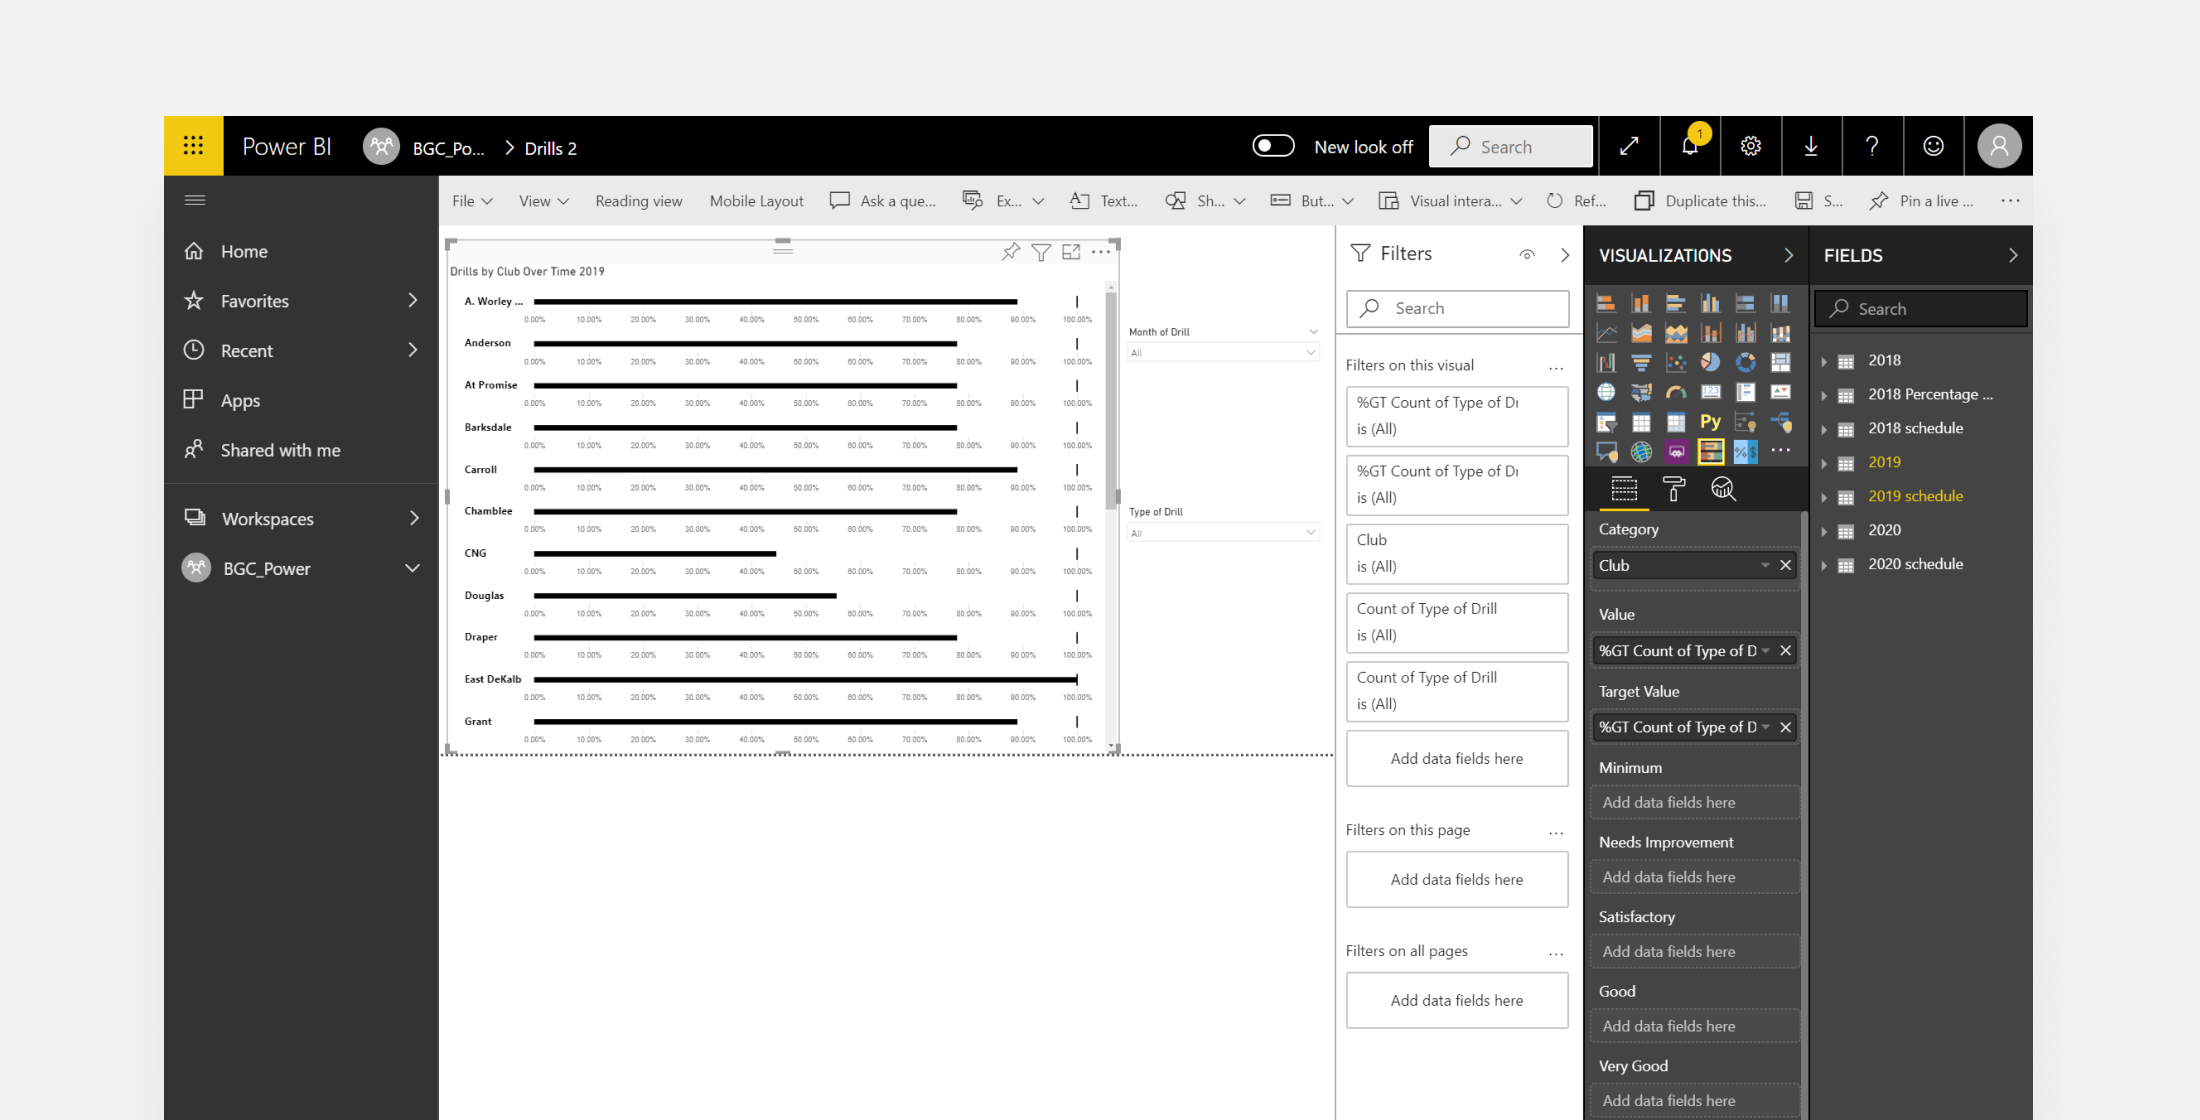
Power BI Workspace
Our customized solution for BGCMA is a Microsoft Power BI Workspace. This workspace importantly contains datasets, reports, and dashboards, which are all interconnected. Users can import spreadsheets or live data to Datasets, organize data visualizations with Reports, and display them to the public with Dashboards.
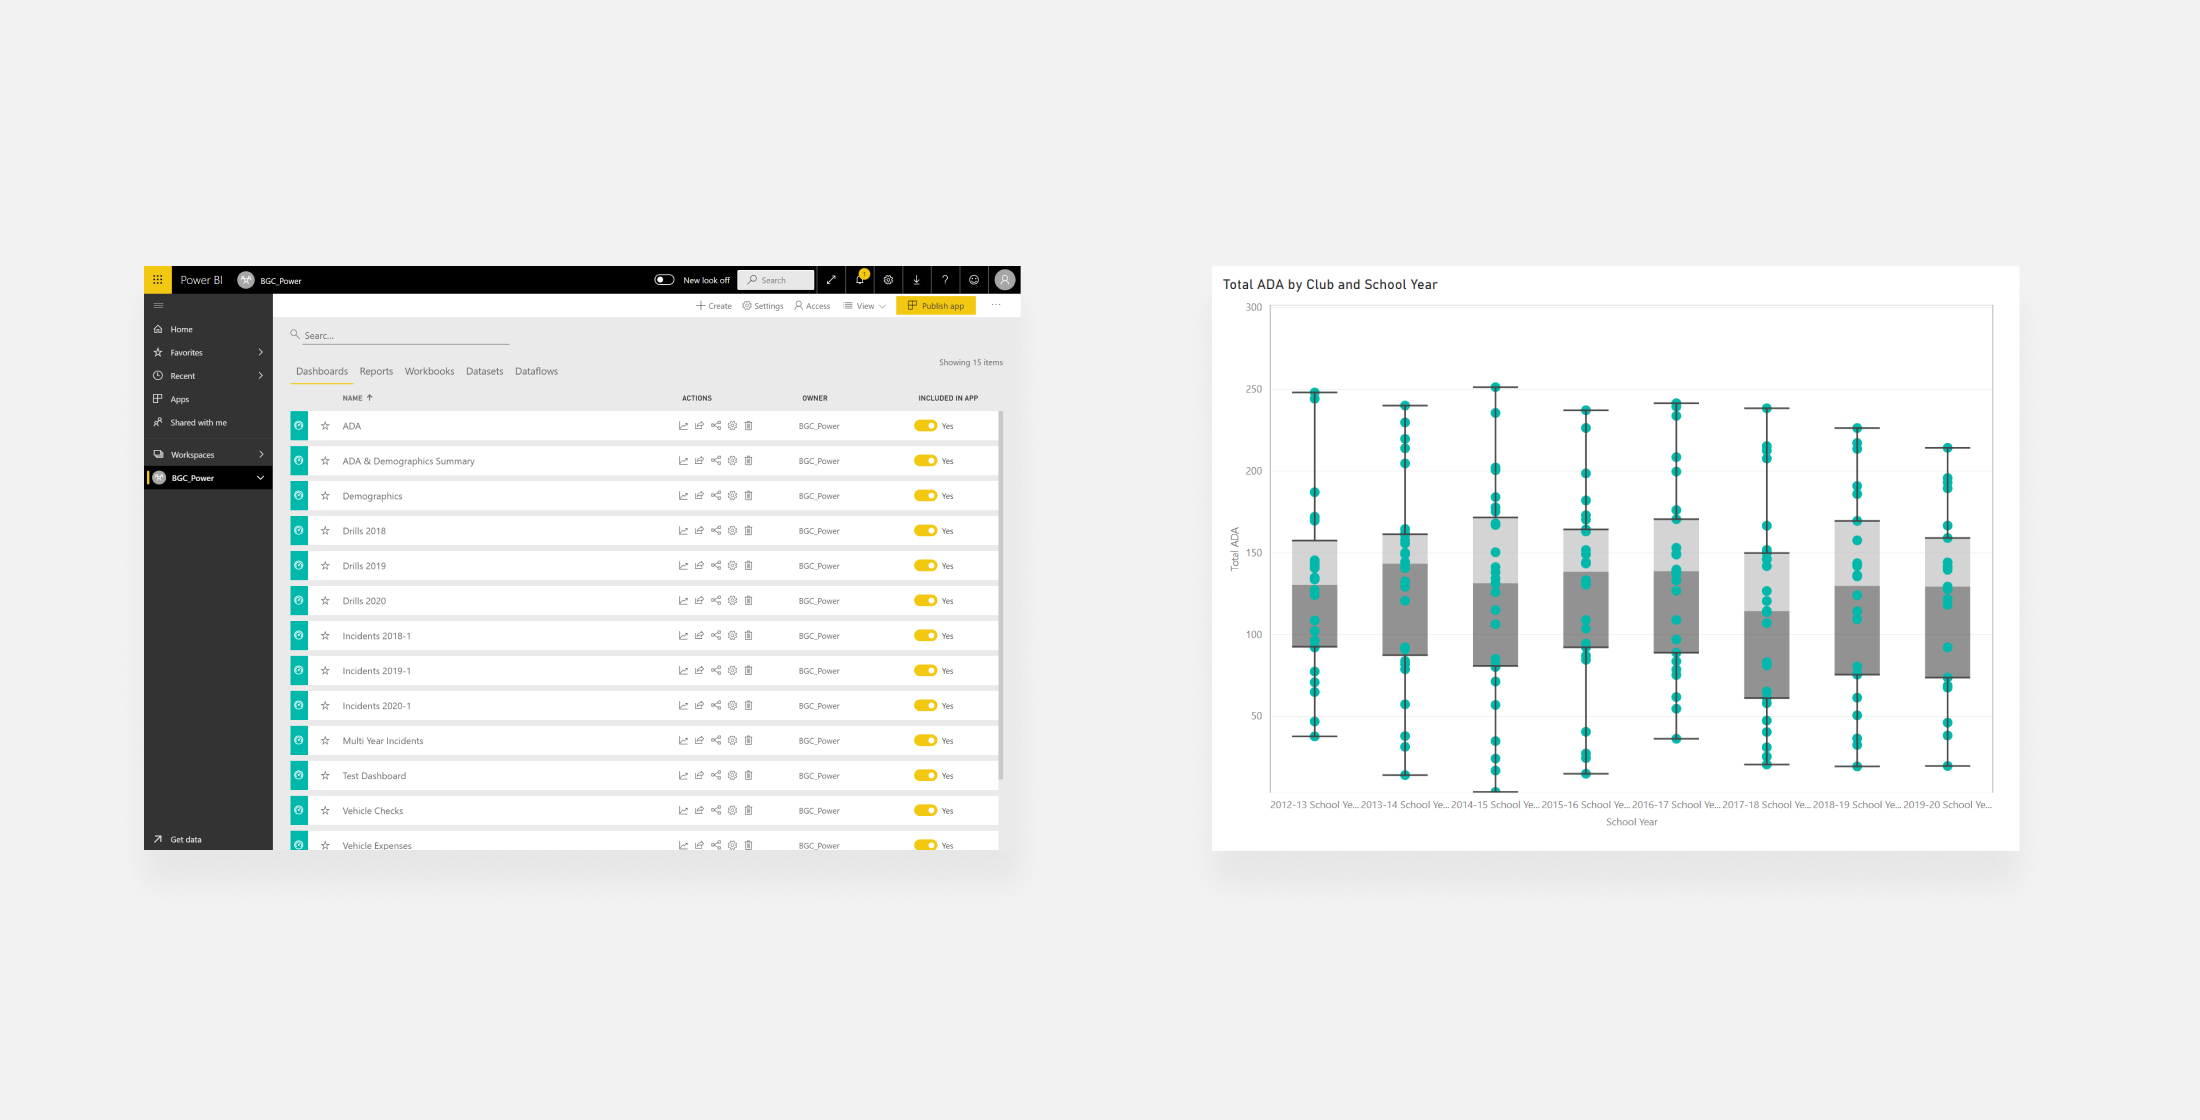
Import Datasets
Power BI is meant to be used dynamically, and as an auxiliary to the aforementioned feature, users can also import their own datasets and create their own dashboards and reports. This feature is an essential part of the product, as existing visualizations must be updated with new data over time, and new visualizations must be created as non-profit priorities change.
Our Team
Reflection 💬

"My favorite part of Bits of Good is the opportunity the organization gives me to be directly involved in projects that have a real life impact. The experiences of working in an organized team and contributing work that directly affects people outside of the classroom has been very rewarding."

"Taking the stakeholders' criteria to research and tailor a product to their needs was one of my favorite parts of the project this semester."

"This project was the first time that I was tasked with the responsibility of not only creating a product that meets the needs of a nonprofit, but also bringing a team of developers together for that cause. BoG has enabled me to succeed in both, fostering skills that I couldn't have gotten elsewhere. I had a blast this semester, and I can't wait to do it again!"
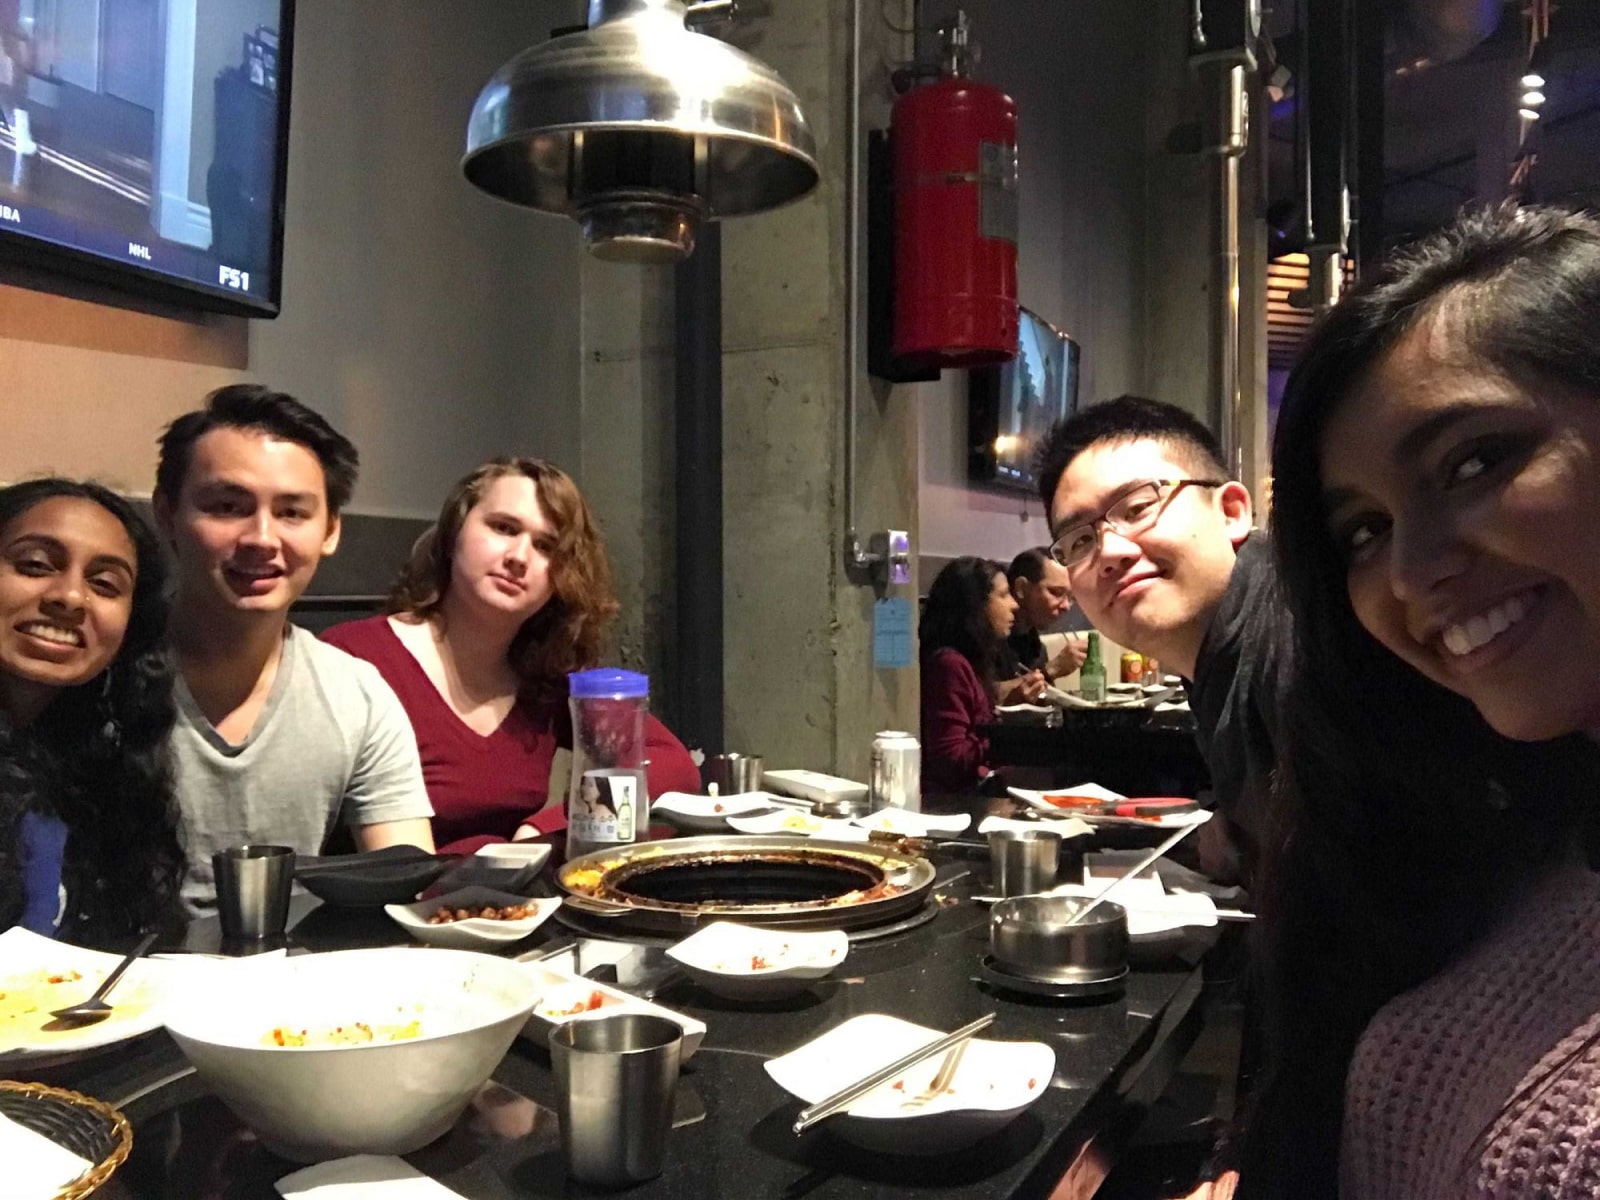
"The power team out on the town getting ramen!"